
Analytical Layer in DIVA | From Data to Decision Intelligence
The Analytical Layer in DIVA transforms territorial data into actionable insights using SQL queries, GIS integration, and structured indicator analysis, enabling data-driven decision-making for cities and regions.
This analytical process is based on a structured indicator system defined in the Indicator Framework.
The Analytical Layer is what transforms raw data into real decision-making power, enabling cities and institutions to act based on evidence rather than assumptions. This makes the DIVA system particularly relevant for policymakers, urban planners, and regional development stakeholders.
The Analytical Layer is the core processing engine of the DIVA system. It integrates structured datasets, applies SQL-based transformations, and generates comparable and decision-oriented outputs across territorial indicators.
This layer enables data aggregation, cross-domain comparison, spatial analysis, and performance evaluation for evidence-based territorial planning.
Key Functions of the Analytical Layer
SQL-based data processing and aggregation
SQL queries transform raw data into structured and comparable outputs across territorial indicators. These outputs are used within the Decision Support layer of DIVA.
Integration of GIS for spatial analysis
Spatial data is integrated to support geographic analysis and visualization of territorial patterns. These outputs are used within the Decision Support layer of DIVA.
Comparative evaluation of territorial indicators
Indicators are compared across datasets, enabling multi-dimensional territorial assessment. These outputs are used within the Decision Support layer of DIVA.
Generation of decision-support metrics
Analytical outputs provide measurable insights for planning, monitoring, and policy evaluation. These outputs are used within the Decision Support layer of DIVA.
Data validation and reliability assessment
Data is classified and evaluated based on source reliability, ensuring transparency and robustness. These outputs are used within the Decision Support layer of DIVA.
Structured data in DIVA is transformed into analytical outputs through SQL-based views, aggregations, and relational queries, enabling consistent interpretation, comparison, and decision-oriented analysis. The analytical layer can also incorporate advanced techniques, including AI-based models, to support pattern recognition and predictive insights when relevant.
Core Analytical Functions
The analytical layer in DIVA is built on structured SQL views and relational queries that transform integrated datasets into consistent, comparable, and decision-oriented outputs.
Relational Aggregation
Data is aggregated across multiple indicator tables using relational joins, enabling cross-category analysis and integrated territorial insights.
SQL-Based Views
Reusable SQL views standardize analytical logic and queries, ensuring consistent outputs across dashboards, reports, and applications.
Comparative Analysis
Indicators are compared across sources, categories, and time dimensions through structured queries and percentage-based calculations.
Ranking and Metrics
Advanced SQL functions (e.g., window functions and ranking) enable prioritization, benchmarking, and performance evaluation of territorial indicators.
Data Quality and Validation Framework
Within the DIVA framework, data quality is treated as a foundational component of the analytical process. Each indicator is systematically evaluated based on its source, reliability level, and degree of validation, ensuring transparency, consistency, and decision-readiness across the entire dataset.
Source Classification
Data sources are classified into structured categories, including local, national, international, and derived datasets. This classification allows for the assessment of data origin, comparability, and territorial relevance, ensuring that the analytical outputs remain grounded in context-specific evidence.
Data classification follows international standards used by institutions such as the World Bank.
Reliability Levels
Each indicator is assigned a reliability level based on the quality and verifiability of its source. The framework distinguishes between high, moderate, low, and estimated (proxy) data, enabling a transparent evaluation of data robustness and supporting informed decision-making.
Validation Logic
The validation process in DIVA integrates multiple layers, including consistency checks, cross-source comparison, and structured data formatting. Indicators are validated through standardized rules embedded in the database architecture, ensuring alignment between data collection, storage, and analytical interpretation.
The following analytical outputs, generated through SQL-based views and aggregations, illustrate the distribution of data sources and reliability levels within the DIVA dataset, providing a visual representation of the data quality framework.
Data Structure and Quality Assessment
The DIVA analytical layer enables the evaluation of both data origin and data reliability, providing a structured understanding of the territorial information base.
Analytical Outputs (SQL-Based Evaluation)
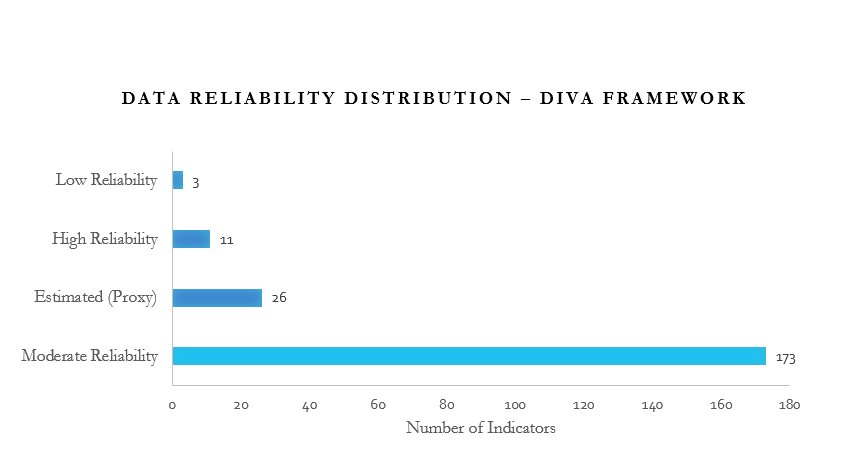
This chart shows the distribution of indicators by reliability level within the DIVA framework, highlighting the predominance of moderately reliable data and areas requiring further validation.
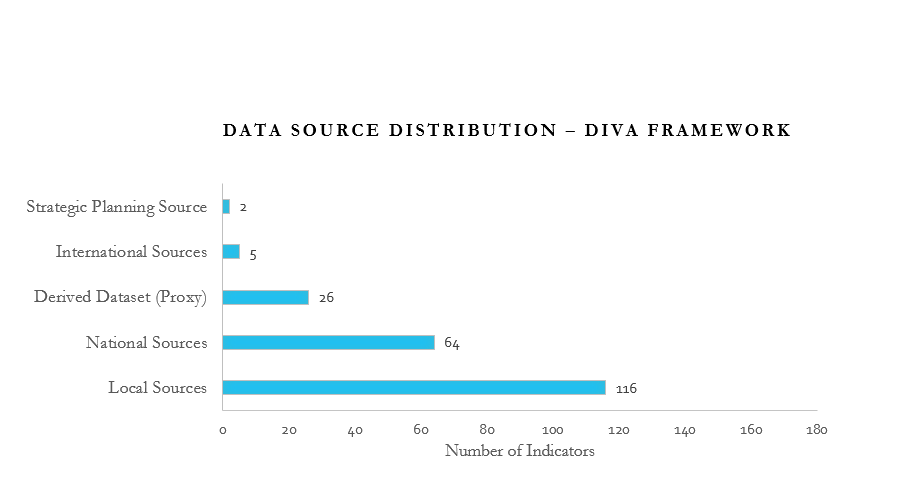
The distribution of data sources reveals a strong reliance on local and national datasets, with limited international inputs, indicating opportunities for expanding comparative benchmarking.
Explore the DIVA Decision Support System
Discover how the Analytical Layer transforms data into real decision-making tools. Explore the DIVA platform and see how territorial intelligence supports planning, policy, and development.